Dec 2024: A Powerful rise - तेजस्वोदयः
Update on Vaikarya
-
We are excited to welcome Rahul, who brings 13 years of investing experience after IIM-A and IIT-KGP. Aligned with our strategy, experienced investors handle all aspects of in-depth stock research. Our five-member team (Annexure 3) includes three senior investors, one AI specialist, and one COO. This team can manage our target fund size over the years.
Investment Environment
Large, mid, and small-cap indices fell 4-5% in the last three months, with 103 NIFTY500 stocks down 15%+. Earnings downgrades drove underperformance, while CDMO, EMS, and rural-focused auto stocks outperformed. After a great run in the last 4.5 years until September 2024, we observe substantial divergence in stock returns, an indicator of the stock picker’s market ahead. See Annexure 1 for more.
Portfolio Update
We have been opportunistically adding to our target set of stocks over the last few months (Annexure 4). We hold significant cash for two reasons. First, we plan to opportunistically deploy funds in our target stocks based on favourable prices and IRRs. Second, a few of our target opportunities may provide favourable prices in the short term as they navigate cyclical factors. As our stated strategy, we size our positions based on risks, favourable price (value) and conviction (evidence of thesis). The size and sectoral distribution of the recent portfolio are below.


As of November 29, 2024, excluding fund flows on that date
Fund Performance
Our fund delivered +1% in the last 3 months (as of Nov 29, 2024), outperforming the market’s -4%, driven by the market discovering some of our stocks. That said, a three-year horizon is most suitable for realizing returns from Vaikarya's strategy as transformative changes in early discovery stocks mature.

Portfolio returns are after management fees and other expenses. Returns over 1 year period are annualized.
-
About 27% of our fund, or about 44% of the allocated portion, consists of stocks such as CDMO names and Capacite, which delivered strong 2QFY25 results and stock performances as they got in the discovery phase.
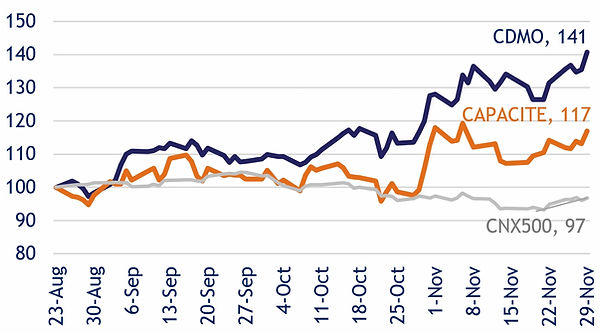
CDMO = average of prices of Piramal Pharma, Innova Captab and stock #13
Source: Tradingview
Investment Strategy

- With a mix of contract manufacturing and other businesses, Piramal Pharma has a long runway for teen growth and the option to benefit from global realignments. It was under-researched/under-discovered due to the negative industry/execution cycle of the last few years.
-
Capacite is on its way to regaining its tier 1 spot in the construction (B&F, RE) industry, growing 20+%. It was under the radar due to distress until late last year. Capital raises, excellent execution and a favourable industry cycle have started their renaissance.
Annexure 1: Investment Environment
Market – Becoming stock picker’s one
- Markets have had a strong collective run in the last 4 years till Aug-2024.

Source: Isec
- Over the three months till Nov-2024, the large, mid, and small-cap indices have been down -4-5% after rebounding from -7-8% down lately. In NIFTY500, 103 stocks are down more than -15%, while only 43 stocks are up 15% or more. After a great run in the last 4.5 years, we observe a strong divergence in stock returns, an indicator of the stock picker’s market ahead.
-
At the macro level, FII flows were negative and driven by US strength and China’s stimulus.
- However, earnings performance is a key factor in the weakest stocks, as shown in the table below. Overall, the Sep-2024 quarter earnings season saw the highest earnings downgrades since the Jun-2020 one.
-
After about -10% correction from the peak and EPS downgrades of -7% in the last six months, NIFTY trades at ~20x forward P/E, near its long-term average.
Recent Correction - Review
- When we examine stock performance over 3 months, we find that 10 out of the bottom 30 stocks have seen large earnings cuts. Other reasons have been negative news flow and valuation corrections due to a subdued outlook.
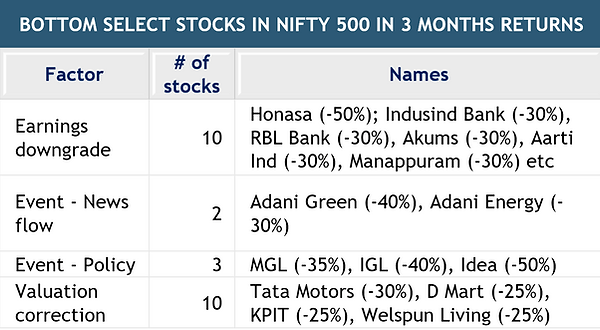
Stock returns for the 3 months ending November 2024 are in parentheses ()
- City Gas Distribution companies like IGL and MAHGL corrected between 30% and 40% on the back of stringent policy action, in which the government announced two APM (Administrative Price Mechanism) allocation cuts in quick succession, thereby once again raising questions on the government’s outlook for the sector and adding further earnings risks.
-
MFI and related stress weighed on many NBFCs/MFIs. It materially surprised negatively, and expectations of peak stress shifted from Q2-25 to H2-25. Unsecured credit has been experiencing de-acceleration since last year due to the regulator’s discomfort. Growth trends for industry credit/deposits are at 12-13%. Margins faced a headwind of a reduced mix of unsecured credit, though the cost of deposits stabilized.
- Adani stocks were impacted by the news of a court order in the US.
-
A few stocks exhibited a correction in valuation multiples—Tata Motors and KPIT were impacted by the global slowdown in Autos. DMART’s multiples corrected on the back of the increasing threat from quick commerce players.
Stock returns for the 3 months ending November 2024 are in parentheses ()
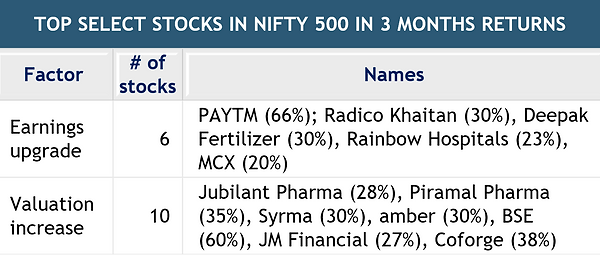
- Looking at best-performing stocks, some of the big gainers this quarter have been CDMO companies, as optimism is built around India’s gain in global share.
-
Similar to the outlook for CDMOs, EMS plays (SYRMA, AMBER, DIXON) have all been strong in hopes of the US levying heavy tariffs on China and these companies benefiting. These companies also reported strong earnings and witnessed marginal earnings upgrades.
- In Autos, after several quarters of urban demand outperforming rural demand, the last quarter saw rural demand making a comeback spurred by a healthy monsoon and upcoming marriage season. If the government's populist schemes continue, this could be positive for 2W and tractors.
-
IT companies reported good results, but the sector outlook is mixed. On one hand, the global slowdown is impacting discretionary spending, and on the other, Trump’s victory has strengthened the dollar.
Annexure 2: Vaikarya’s Approach
Portfolio Construction
- Over the last few months, we have been opportunistically adding to our target set of stocks. We hold significant cash for two reasons.
- First, we plan to opportunistically deploy funds in our target stocks based on favourable prices and IRRs. As shown below, volatile markets can provide opportunities to accumulate the target stocks at reasonable prices with a long-term value mindset.

Source: NSE. Data considered for the period Sep 1st, 2024 to Nov 30th, 2024
- Second, a few of our target opportunities may provide favourable prices in the short term as they navigate cyclical factors. For example, MFI space has been under tremendous stress. Direct MFI stocks have seen major value erosion, and some may have to navigate solvency risk via equity infusions. Additionally, those who have some exposure to MFI have also seen material price dislocations.

Source: Tradingview
-
The current MFI crisis is very severe relative to its history, as shown below in the valuation vs credit costs of CREDAG. We track factors such as stress formation and industry/regulation actions to access low-risk opportunities, mainly in lenders partly exposed to MFI.

Source: Vaikarya, company and other public disclosures
As our stated strategy, we size our positions based on risks, price (value) and conviction (evidence of thesis).
Transformative Changes vs Market Cycle
Our fund’s performance in the last three months was driven by the discovery of our stocks’ transformative market changes. For example, stocks in the CDMO space, such as Piramal Pharma and Innova Captab, are up about 49% in the last three months despite weakness in the broader market. As of November end, the fund holds about 7.5% of the portfolio or about 12% of non-cash allocation in three CDMO companies.
Case Study of Piramal Pharma

CDMO = average of prices of Piramal Pharma, Innova Captab and stock #13
Source: Tradingview
-
Piramal Pharma got demerged from a conglomerate in 2022 during a negative industry cycle.
-
Continued margin misses (FY23 EBITDA margins of 9% vs. ~20% pre-COVID) kept this stock under the radar. Piramal is under-owned by domestic mutual funds, and sell-side coverage was very limited compared to peers.
-
The promoters infused capital (rights) to invest in the business. The business CEOs were changed, and the new hires were from Lonza/Accord.
-
The evidence of execution reset and some improvement in the industry cycle started emerging last year.
-
A strong order book (mostly from innovators) is now helping to increase operating leverage and build a favourable business mix.
-
After around 30% decline in EBITDA in both FY22 and FY23, the company has reported 80% EBITDA growth in FY24 and 37% growth in 1HFY25.
-
The company is undergoing a strong transformation now, reflected in the stock price — Piramal Pharma is up 2.2x in the last year and 40% in the previous three months when markets have been volatile.
-
As the business comes on track, the company’s guidance implies 20-25% CAGR in EBITDA (or 9-10x growth in PAT) over the next 5 years.
Annexure 3: The Team

AVNISH TIWARI
Partner,
CIO
-
16 YEARS OF INVESTING

2014 - 23
Managing Director
2012 - 14
2008 - 12
-
EDUCATION

MBA 2008

B.Tech 2001

AVNISH BURMAN
Partner,
Senior Investment Professional
-
15 YEARS OF INVESTING
2014 - 24
Principal
2010 - 14
2009 - 10
-
EDUCATION

MBA 2009

B.Tech 2004
_edited_edited.jpg)
RAHUL KUMAR
Senior Investment Professional
-
13 YEARS OF INVESTING
2016-24
Arthveda
2012 - 15
2011 - 12
-
EDUCATION

MBA 2011

B.Tech 2006
_edited_edited.jpg)
GAURAV SHETTY
Chief Operating Officer
-
EXPERIENCE
5 years of specialised experience in AIF Tax & Regulatory compliance

2023 - 24

2019 - 23
-
EDUCATION
Bachelor of Law (LL.B. 2023)
Chartered Accountant 2018

PRASHANT KADAM
Data Analyst - AI tools / Alternate data
-
EXPERIENCE
2014 - 23
-
EDUCATION

DJ Sanghvi College of Engineering BE (9.1/10.0 CGPA)
Annexure 4: Portfolio Snapshot
Investee Companies
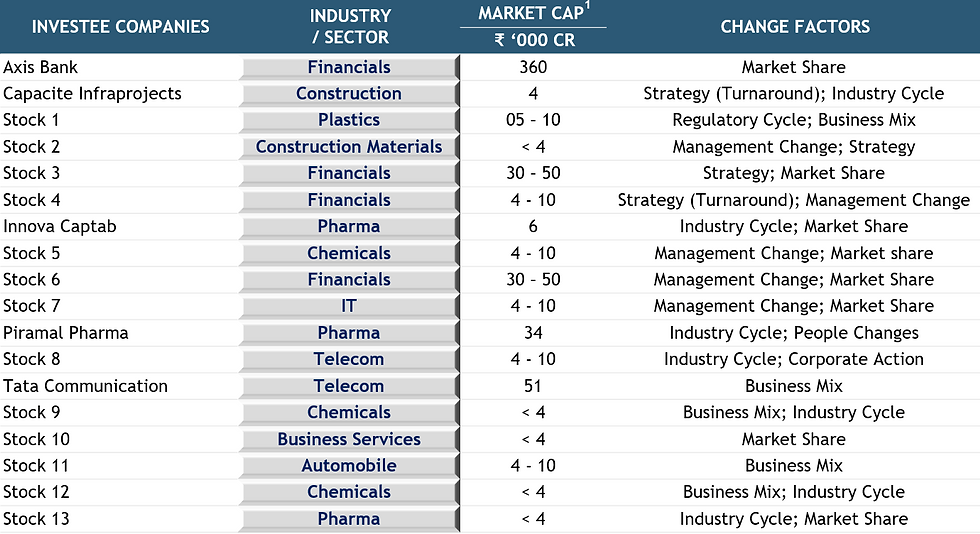

Market Capitalisation (Size) Distribution

Sectoral Distribution
Notes
-
The portfolio distribution across size and sector is as of November 29, 2024, excluding fund flows on that date.
-
Market caps are approximated as of December 9, 2024. Sources: Ace Equity and publicly available disclosures.
Risk disclosures
- Concentration Risk: The portfolio is diversified across multiple sectors and key economic indicators, mitigating concentration risk.
- Foreign Investment Risk: The Fund does not hold investments in foreign entities, eliminating exposure to foreign investment risks.
- Leverage Risk: The Fund operates without the use of leverage. Hence, there is no leverage risk.
- Realization Risk: Portfolio investments consist of listed or soon-to-be-listed entities, providing clarity on potential realization pathways and resulting in negligible realization risk.
- Strategy Risk: The portfolio remains fully aligned with the stated strategy of Vaikarya Change India Fund, which has been consistently maintained since inception.
- Reputation Risk: Investments are restricted to listed or soon-to-be-listed entities, ensuring adherence to high governance and transparency standards, resulting in negligible reputation risk.
- ESG Risk: The Fund adheres to established ESG practices and believes that portfolio companies also follow strong ESG principles.
- Fees: Fees are charged as per the Private Placement Memorandum (PPM) read with Fund Documents.
Disclaimer
This document (the “Letter”) is being furnished to you by Vaikarya Change LLP (“Vaikarya”) and its authorized agents on a confidential basis solely for the purpose of providing information regarding Vaikarya and an investment in Vaikarya Change India Fund (“Fund”), which is a scheme of Vaikarya Change India Trust (“AIF”). Vaikarya Change India Trust is registered with SEBI as a Category III Alternative Investment Fund having registration number IN/AIF3/24-25/1536.
The information contained in this Letter is confidential to the person, company, partnership, or other entity to whom it is given (the “Recipient”) and, without the prior written consent of Vaikarya, should neither be disclosed to any other person, company, partnership, or other entity (except to the Recipient’s legal counsel and/or other professional advisers), nor copied nor reproduced in whole or in part. This Letter must be returned, along with any supplemental information provided to the Recipient, and any copies destroyed, immediately upon the request of Vaikarya. By accepting delivery of this Letter, each Recipient agrees to the foregoing and the terms and conditions below. This Letter is prepared by Vaikarya strictly for the specified audience and is not intended for distribution to the public and is not to be disseminated or circulated to any other party outside of the intended purpose. This Letter is not directed to, nor intended for distribution or use by, any person or entity in any jurisdiction or country where the publication or availability of this Letter or such distribution or use would be contrary to local law or regulation.
This Letter is made for informational purposes only and should not be regarded as an official opinion of any kind or a recommendation. This Letter is not, and under no circumstances is it to be construed as, an offering document or an advertisement, and the furnishing of this Letter to the Recipient is not, and under no circumstances is it to be construed as, an offering (public or otherwise) of interests in the Fund. The contents of this document should not be treated as advice relating to investment, legal, or taxation matters. It is recommended that the Recipient consult their stockbroker, banker, legal adviser, and other professional advisers to understand the contents of this Letter. Vaikarya does not provide legal or tax advice, and if necessary, you should approach independent professional tax or legal advisors to obtain the same.
This document is confidential, and any unauthorized use or reproduction of any information contained in this document is strictly prohibited. The views in this document are generally those of Vaikarya and are subject to change without notice, and Vaikarya is not under any obligation to update its views or the information in this document. Neither Vaikarya, nor its promoters, directors, officers, employees, or representatives shall accept any responsibility for any direct, indirect, or consequential loss suffered by you or any other person as a result of you acting, or deciding not to act, in reliance upon such information, opinions, and analysis. The contents of this document have not been reviewed by any regulatory authority in India or in any other jurisdiction. If you have any doubt about any of the contents of this document, you should obtain independent professional advice.
The portfolio of the Fund is subject to changes within the provisions of the Private Placement Memorandum of the Fund. Investments are subject to market risks. Past performance is not an indicator of future performance, and there can be no assurance or guarantee that any investment will achieve any particular return. The performance of the Fund may be adversely affected by the performance of individual companies, changes in the market conditions, micro and macro factors, and forces affecting capital markets, including interest rate risk, credit risk, liquidity risk, and reinvestment risk. Fund will be exposed to various risks depending on the investment objective, investment strategy, and the asset allocation. The sector(s)/stock(s)/issuer(s) mentioned in this document do not constitute any research report/recommendation of the same, and the Fund may or may not have any future position in these sector(s)/stock(s)/issuer(s). Any projections, forecasts, and estimates contained in this Letter are necessarily speculative in nature and are based upon certain assumptions. It can be expected that some or all of such assumptions will not materialize or will vary significantly from actual results. All projections, forecasts, or “forward-looking statements” relating to expectations regarding future events or the possible future performance of the Fund contained in this Letter are those of Vaikarya only and represent Vaikarya’s own assessment and interpretation of information available to it as at the date of this Letter and are subject to change without notice as a result of known and unknown risks, uncertainties, and other factors which may cause actual results or eventualities to be materially different from those contemplated in such statements.
The Recipient should not treat the contents of this Letter or any prior, or subsequent, communications from Vaikarya, any of its affiliates or any of their respective directors, officers, employees, partners, members, agents, professional advisers, representatives, and/or consultants as advice relating to legal, taxation, or investment matters and are advised to consult their own professional advisers concerning the acquisition, holding, or disposal of interests in the Fund.